
MedITEX KPI

Turn Your Fertility Clinic’s Data
Into Better Decisions
Fertility clinics generate large amounts of data every day: from treatments and lab results to patient demographics and outcomes. But without the right tools, this data remains unused.
MedITEX KPI transforms your clinic’s information into clear, actionable insights that help you improve performance, detect issues early, and make confident decisions backed by real data.

Instant Access to Key Indicators
MedITEX KPI provides a wide range of pre-configured metrics and performance indicators, all available on demand. You can quickly view key rates, indexes, and trends without manual calculations.
This way, you can easily:
See Trends Before They Become Problems
By combining data from different MedITEX modules (Lab, Cryo, Management, and more), MedITEX KPI gives you a complete and real-time overview of your clinic’s performance.
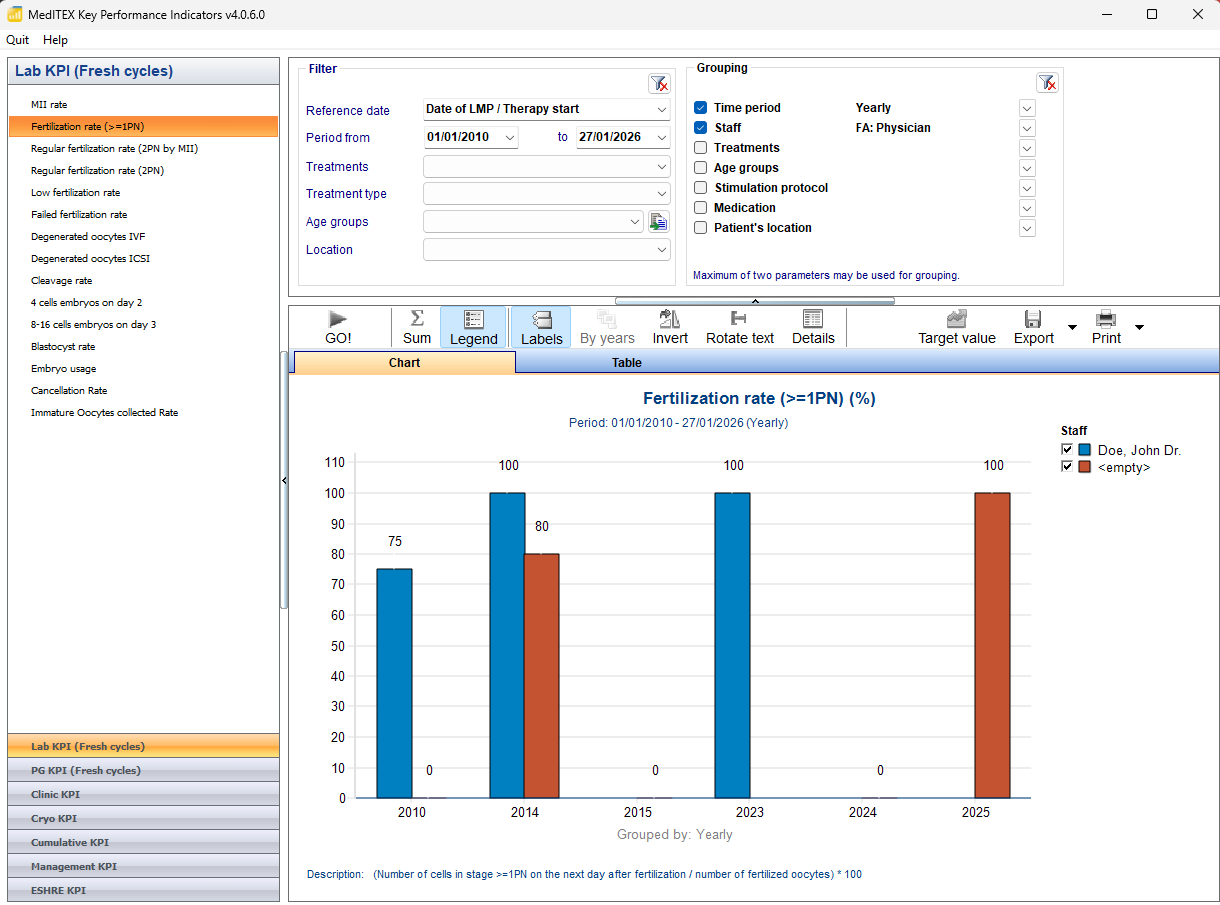
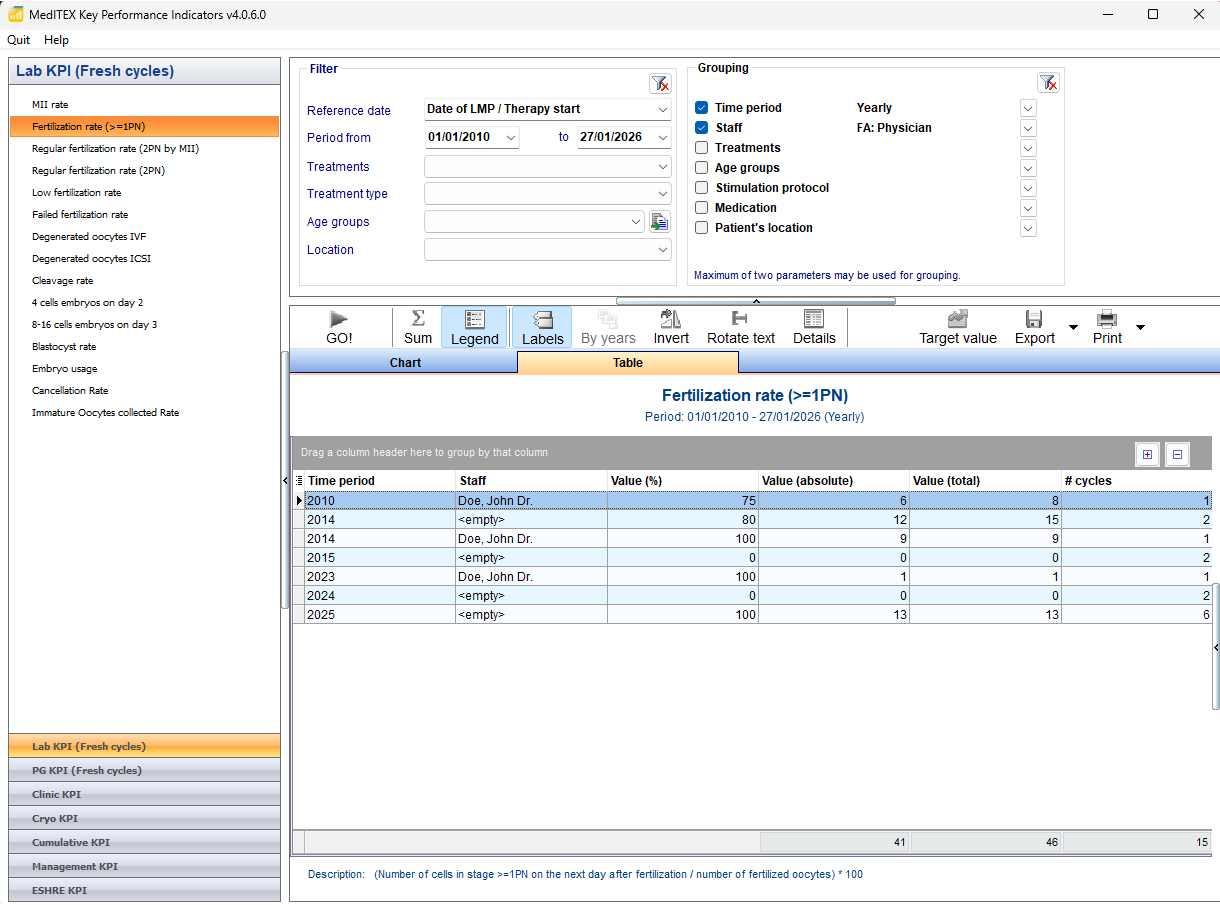
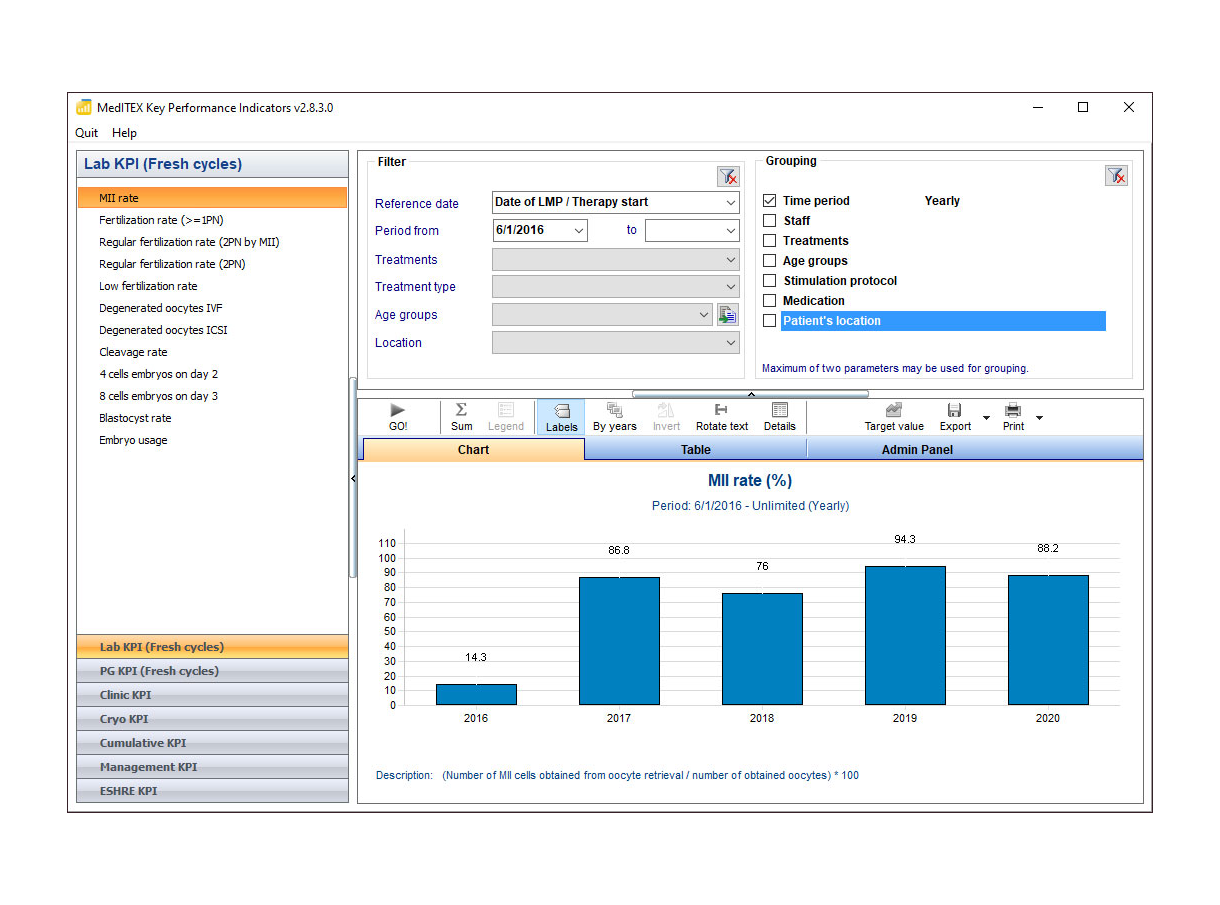
MedITEX KPI runs quietly in the background and helps you:
Clear graphs and ratings immediately show where attention is needed, helping you maintain high standards and optimize patient results.
Flexible Filtering and Grouping
You can refine your analysis using filters for:
- Reference date
- Time period
- Treatments
- Treatment type
- Age groups (fully editable)
And group your data by:
- Time period
- Staff
- Treatments
- Age groups
This flexibility allows you to analyze exactly the information you need — no more, no less.
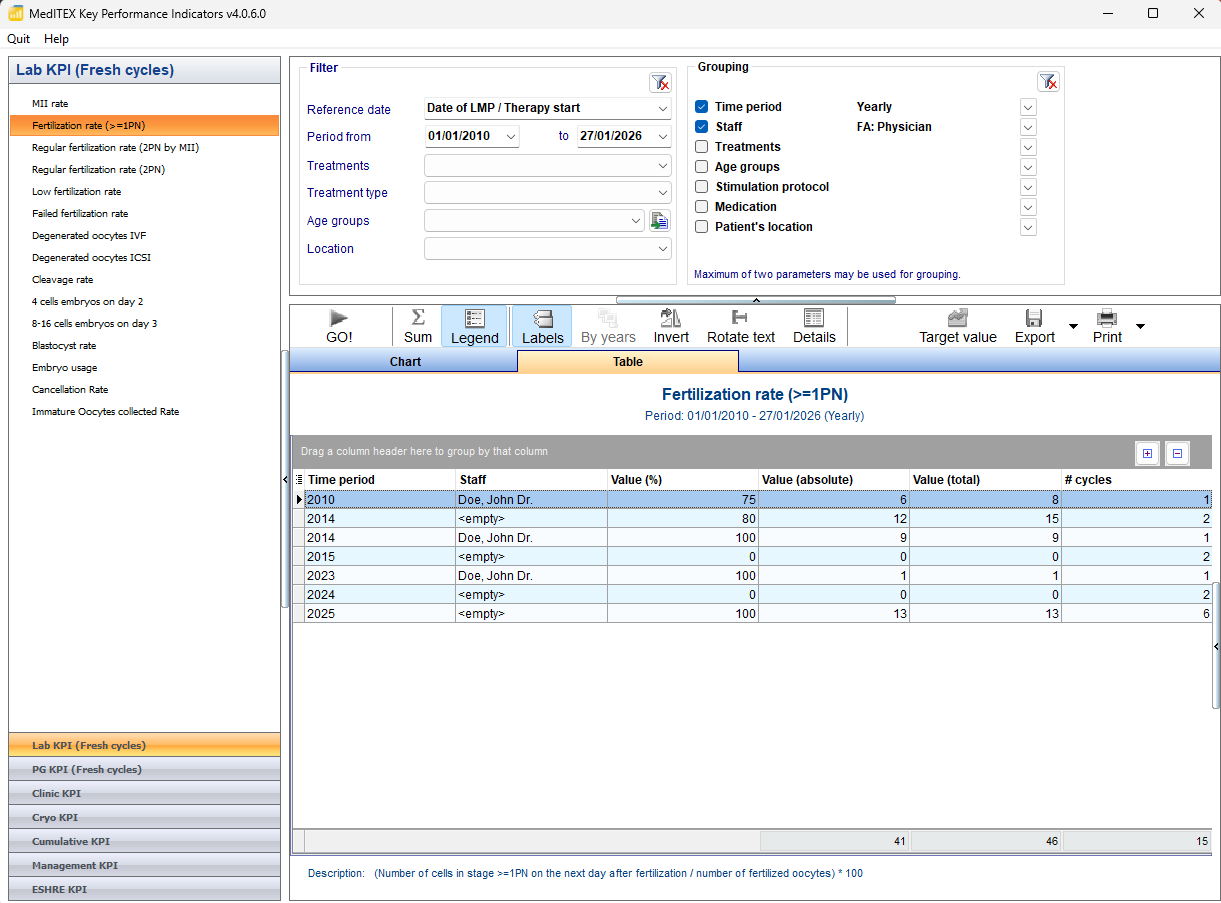
Powerful Visualization and Reporting Tools
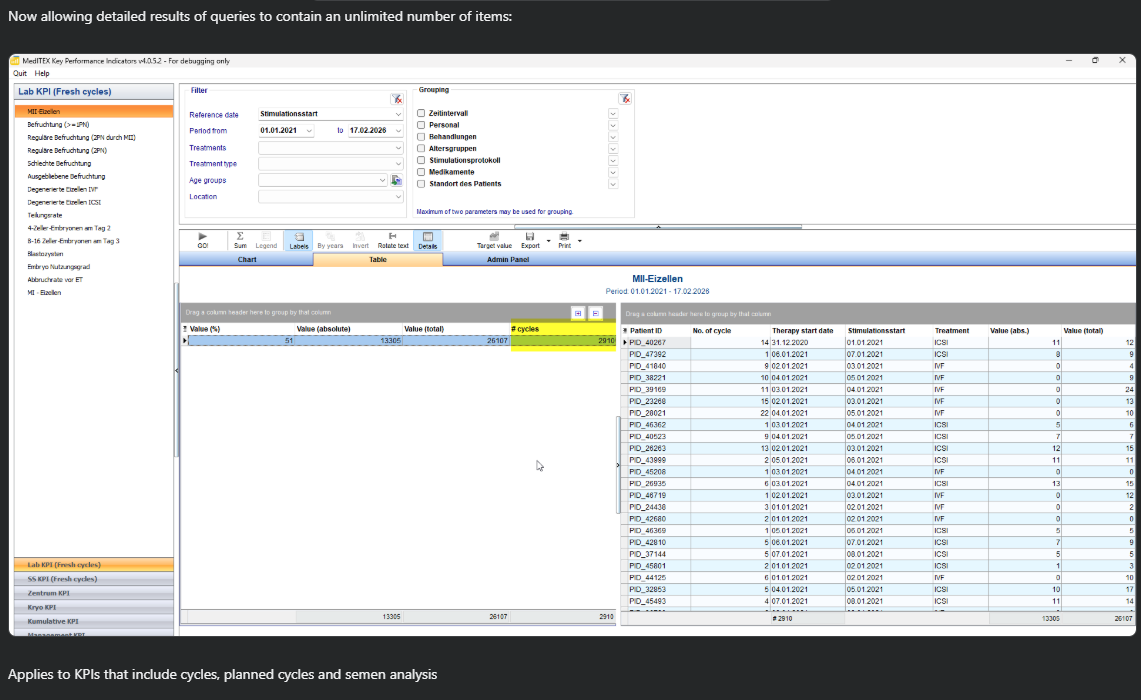
The Results area displays charts and tables created directly from MedITEX IVF data. The toolbar makes it easy to adjust how information is shown.
Everything is designed to deliver clarity at a glance.
Designed for Fertility Clinics That Want to Improve Continuously
MedITEX KPI brings your most important data together, evaluates it in real time, and presents it in a way that is easy to understand. It strengthens your ability to monitor performance, optimize workflows, and raise the quality of care throughout your clinic.
Contact sales@critex.de